Photometrics (imaging followed by computationally assisted feature extraction and measurement) promises to revolutionize biological research and agricultural production systems. Automation of workflows remains a key challenge in the scaling of these approaches to cope with the requirements of large genetic experiments or, indeed, food production systems. Phenotyping aims to measure observable plant features, often as a response to environmental cues and/or variability between individuals. Traditionally, phenotyping has been a labour-intensive and costly process, usually manual and often destructive. High-throughput phenotyping technologies aim to address this problem by the use of non-destructive approaches either in glasshouses or directly in the field integrating imaging, robotics, spectroscopy, high-tech sensors, and high-performance computing.
This work demonstrates that deep learning can be used to estimate fruit number from images. In particular, we have developed DeepPod, a framework for Arabidopsis silique detection that involves a deep neural network for patch-based classification and an object reconstructor for silique localization and counting. The framework has been validated using a separate dataset of 2,408 images from biological experiments. This allowed the analysis of large numbers of plants' inflorescences in an accurate and effective way, providing a cost-effective alternative to manual counting.
Building CNN classifiers
DenseNet is a model notable for its key characteristic of bypassing signals from preceding layers to subsequent layers that enforces optimal information flow in the form of feature maps. Amongst DenseNet variants, DenseNet-Basic is a successful model proposed for the image classification challenges. Hereafter, DenseNet-Basic is referred to as “DenseNet.” A simple DenseNet is made up of a total of L layers, while each layer is responsible for implementing a specific non-linear transformation, which is a composite function of different operations such as batch normalization, rectified linear unit, pooling, and convolution. Within a dense block that consists of multiple densely connected layers with such composite functions, all layers are directly connected to each other, and each layer receives inputs (i.e., feature maps) from all preceding layers (as illustrated in the middle row of Figure 1). The number of feature maps generated from the composite function layer is usually fixed and is called the growth rate (k) for the DenseNet. To facilitate down-sampling for CNNs, the network used for our experiment consisted of multiple dense blocks. These dense blocks were connected to each other through transition layers (composed of a batch normalization layer, a 1 × 1 convolutional layer, a dropout layer, and a 2 × 2 average pooling layer as shown in the bottom row of Figure 1).
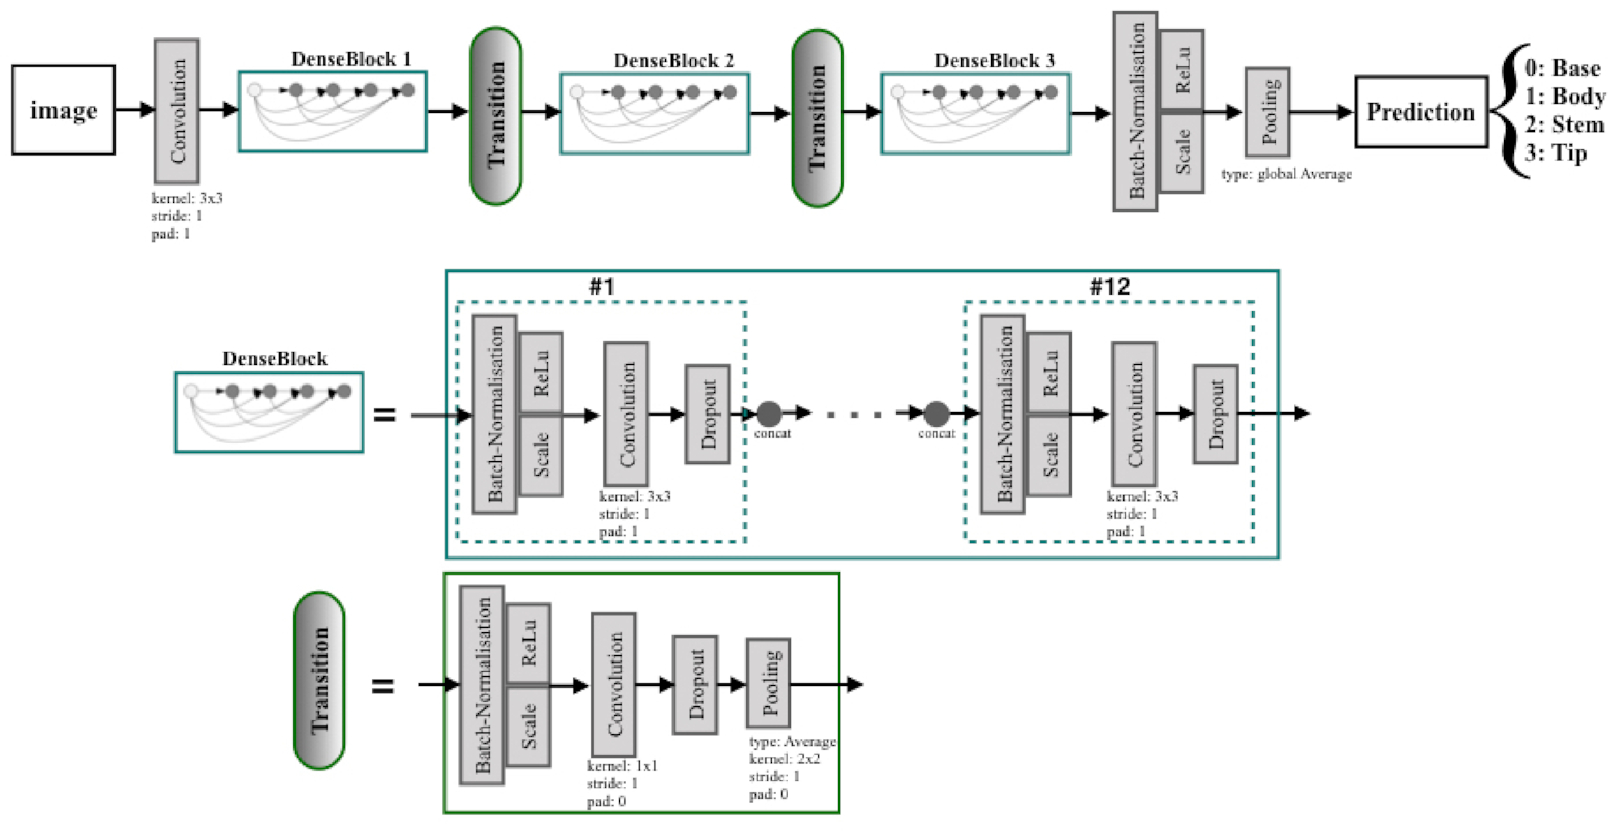
The growth rate (k) was set to 12 for all dense blocks in order to generate narrow layers within the overall DenseNet structure (i.e., 3 dense blocks with equal number of layers and 2 transition layers). A relatively small growth rate (of 12) was found to be sufficient to obtain satisfying results on our target datasets. The initial convolution layer incorporated 16 convolutions of size 3 × 3 on the input images. The number of feature maps in all other layers follows the setting for k. At the end of the last dense block (third dense block), a global average pooling was performed to minimize over-fitting by reducing the total number of parameters in the model. The final Softmax classifier of 4 output nodes will predict the probability for each class on the basis of the extracted features in the network.
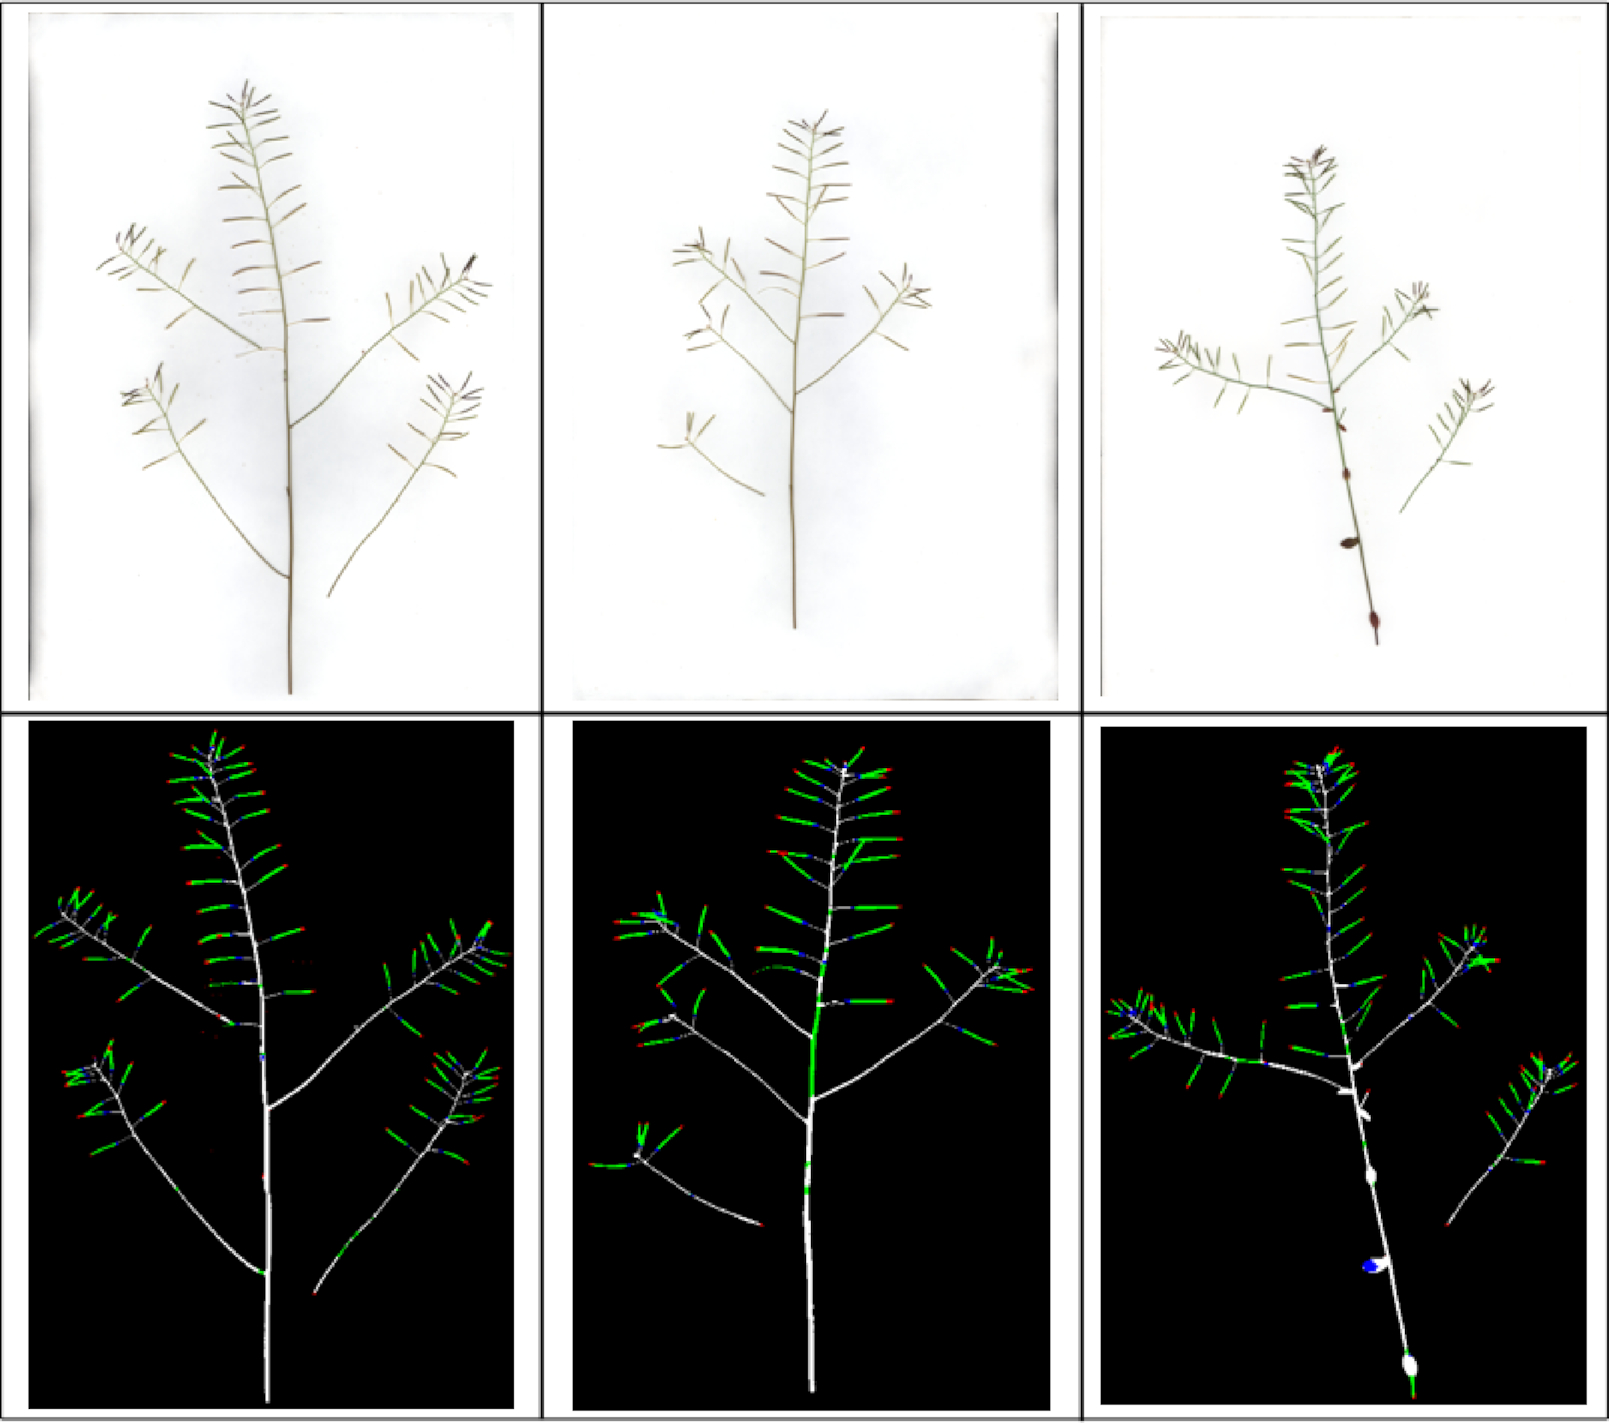
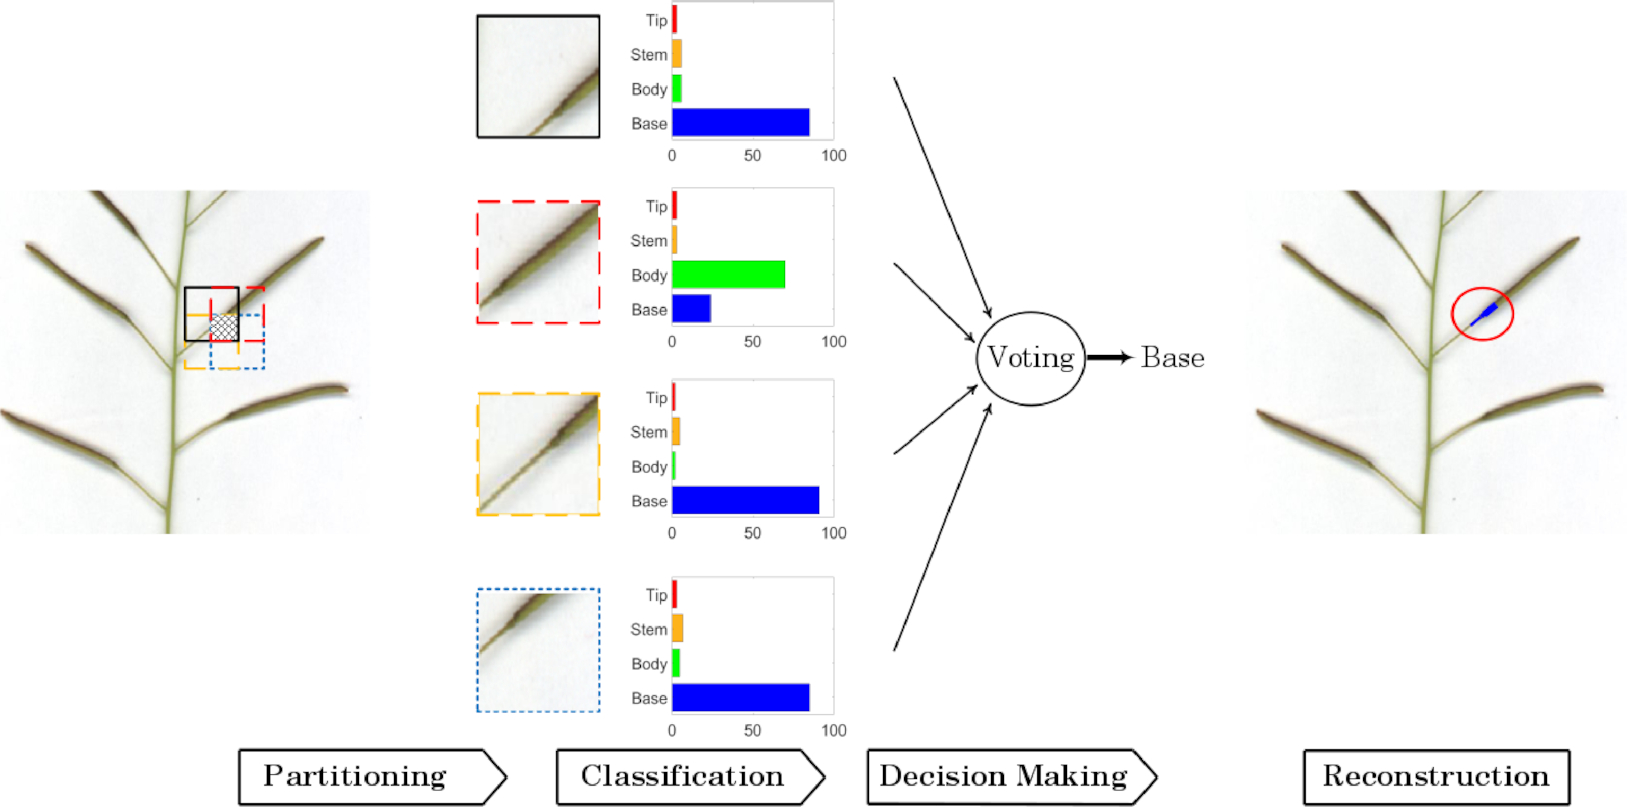
Image reconstruction: Given the classification of various patches in an image, post-processing can be applied to reconstruct the image and detect probable silique appearances. The plant regions are first identified from the background (including borders) using simple thresholding methods. Then the plant regions are further segmented into 4 classes based on labelling of the patches of interest. Because the patches for a test image are generated with 50% overlap along both the horizontal and vertical directions, each patch consists of 4 squares of equal size (16 × 16), called sub-patches. Each sub-patch has 4 class predictions from 4 adjacent patches, the final decision is inferred through majority vote, and the label for each pixel in the sub-patch was determined accordingly (Figure 2). In case of a tied vote for several classes, the average probability of those classes for the image will be assigned to the sub-patch and its pixels.
Experimental Results
| Predicted | Actual | Precision (%) | Recall (%) | |
| Base | Body | Stem | Tip | |
| Base | 392 | 4 | 14 | 2 | 93.6 | 95.1 |
| Body | 15 | 290 | 13 | 33 | 93.2 | 82.6 |
| Stem | 11 | 14 | 290 | 2 | 91.5 | 91.5 |
| Tip | 1 | 3 | 0 | 295 | 88.9 | 98.7 |