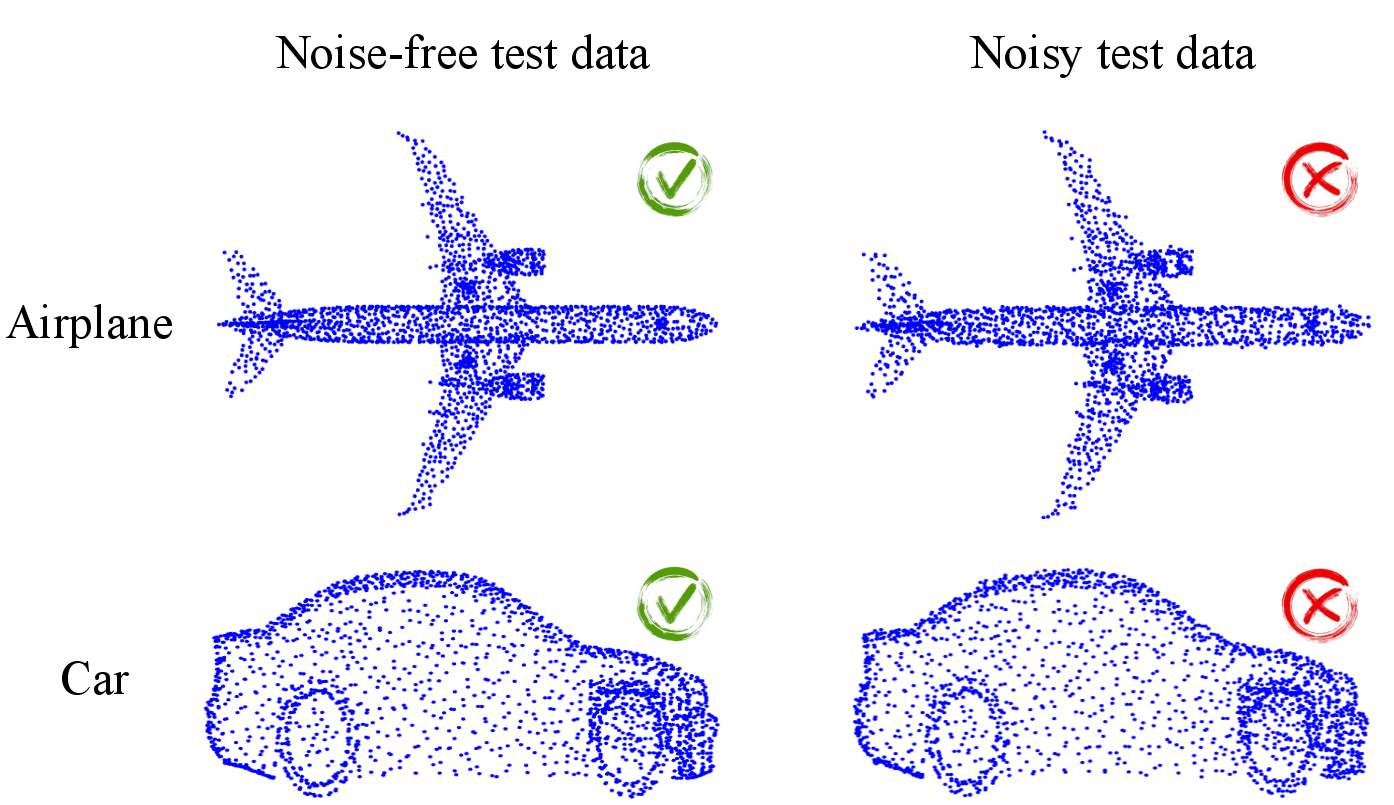
Object classification and semantic segmentation of 3D models are foundations of numerous computer vision applications like autonomous driving and robot manipulation. Thus far, a considerable number of convolutional neural networks (CNNs) have been developed for such tasks and in most cases they yield promising results, especially when the distributions of test and train datasets are similar. However, 3D models in the real world contain out-of-distribution samples, different samplings, noise and distortions that significantly influence their performance. Figure 1 shows a few examples of wrong classification in the presence of noise.
In this study, we propose a smart yet simple deep network for analysis of 3D models using the interesting ‘orderly disorder’ theory. Orderly disorder is a way of describing the complex structure of disorders within complex systems. Our method extracts the deep patterns inside a 3D object via creating a dynamic link to seek the most stable patterns and at once, throws away the unstable ones. Patterns are more robust to changes in data distribution, especially those that appear in the top layers. Features are extracted via an innovative cloning decomposition technique and then linked to each other to form stable complex patterns. Our model alleviates the vanishing-gradient problem, strengthens dynamic link propagation and substantially reduces the number of parameters.
Orderly Disorder Theory
The orderly disorder theory was introduced in physics and it refers to a way of describing the complex structure of disorders within complex systems. Unpredictable disorders could occur just under external disturbances not because of internal reasons. Ordered/predictable disorders may not be seen by human vision and this increases the ambiguity between the predictable and unpredictable disorders. However, the entropy metric could give us the degree of chaos inside a complex structure. Chaos theory has been well studied in mathematics, behavioral science, management, sociology etc. With the success of CNNs in solving high-order problems, this study aims at deeply analyzing the links between points in the given point cloud.
The Proposed Pattern-Net
We claim that the classification score of a 3D object must not be varied under changes in the density and distribution of points if the number of points is sufficiently large, i.e. \[\ \Gamma_{[p_1,...,p_N]} = \Gamma_{[p_1,...,p_M]}\qquad if \qquad N < M\ \&\ N\gg1,\] where
- \(P=\{p_m\in\mathbb{R}^d, m=1,...,M\}\): input point cloud
- \(\Gamma_c=\{\gamma_c\in\mathbb{R}, c=1,...,C\}\): classification labels with C classes
- \(M\): total number of 3D points
One possible solution to the above equation is to decompose the input point cloud into 'L' levels via a random down-sampling operator in such a way that all L point subsets are completely different while their overall schemes/abstracts are similar to each other. Under these conditions, the equation above is asserted. If we apply a random down-sampling operator to point cloud 'P' that provides
i- \(\ P{\{l\}} \cap P\{j\} = \emptyset \quad \forall \,l,j \in \{1,...,L\}\ \&\ l\neq j,\)ii-\(\ \bigcup^L_{l=1}P{\{l\}} = P\)
iii-\(\ H(P{\{l\}}) \simeq H(P{\{j\}}) \quad \quad \forall\, l,j \in \{1,...,L\}\ \&\ l\neq j\)
then we can assert that all the 'L' point subsets have similar 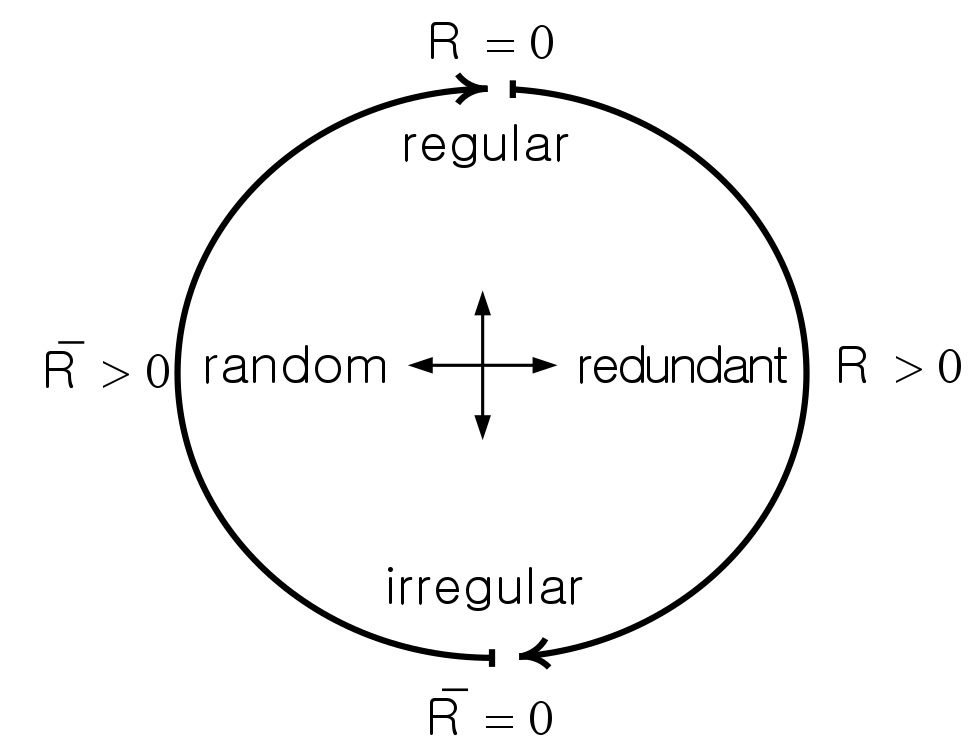
Experimental Results
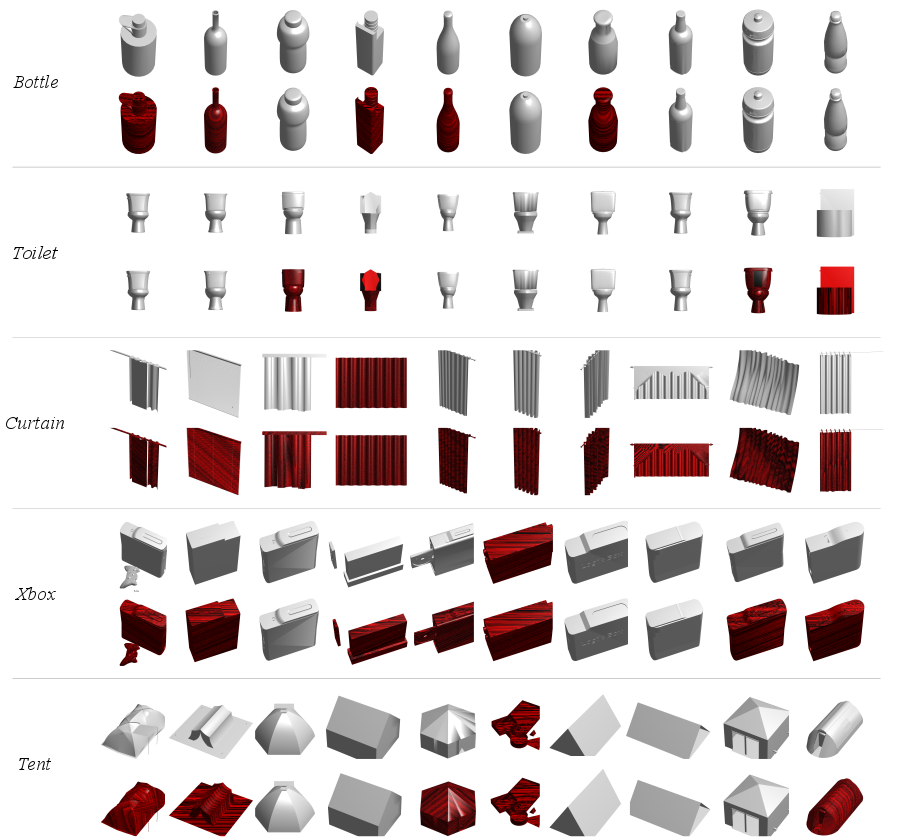
Extensive experiments on challenging benchmark datasets verify the superiority of our light network on the segmentation and classification tasks, especially in the presence of noise wherein our network’s performance drops less than 10% while the state-of-the-art networks fail to work. A summary of the results is shown below.
Classification
| Classifier | Input | Avg. classes | Overall | PointNet | 1k-xyz | 86.0 | 89.2 |
| PointNet++ | 5k-xyz | - | 91.9 |
| PointCNN | 1k-xyz | 88.1 | 92.2 |
| ECC | 1k-xyz | 83.2 | 87.4 |
| DGCNN | 2k-xyz | 90.7 | 93.5 |
| SO-Net | 2k-xyz | 88.7 | 90.9 |
| DensePoint | 1k-xyz | - | 93.2 |
| RS-CNN | 1k-xyz | - | 93.6 |
| Pattern-Net | 1k-xyz | 90.3 | 92.9 |
| Pattern-Net | 2k-xyz | 90.7 | 93.6 |
| Pattern-Net | 4k-xyz | 90.8 | 93.9 |
| Classifier | N(0,0.02) | N(0,0.05) | N(0,0.08) | N(0,0.1) | N(0,0.15) |
| PointCNN | 78.7 | 40.8 | 18.6 | 10.5 | 4.7 |
| DGCNN | 92.9 | 69.1 | 29.9 | 11.4 | 4.2 |
| SO-Net | 70.6 | 35.4 | 11.9 | 9.8 | 5.8 |
| Pattern-Net(4x512) | 93.5 | 92.4 | 89.1 | 84.2 | 32.6 |
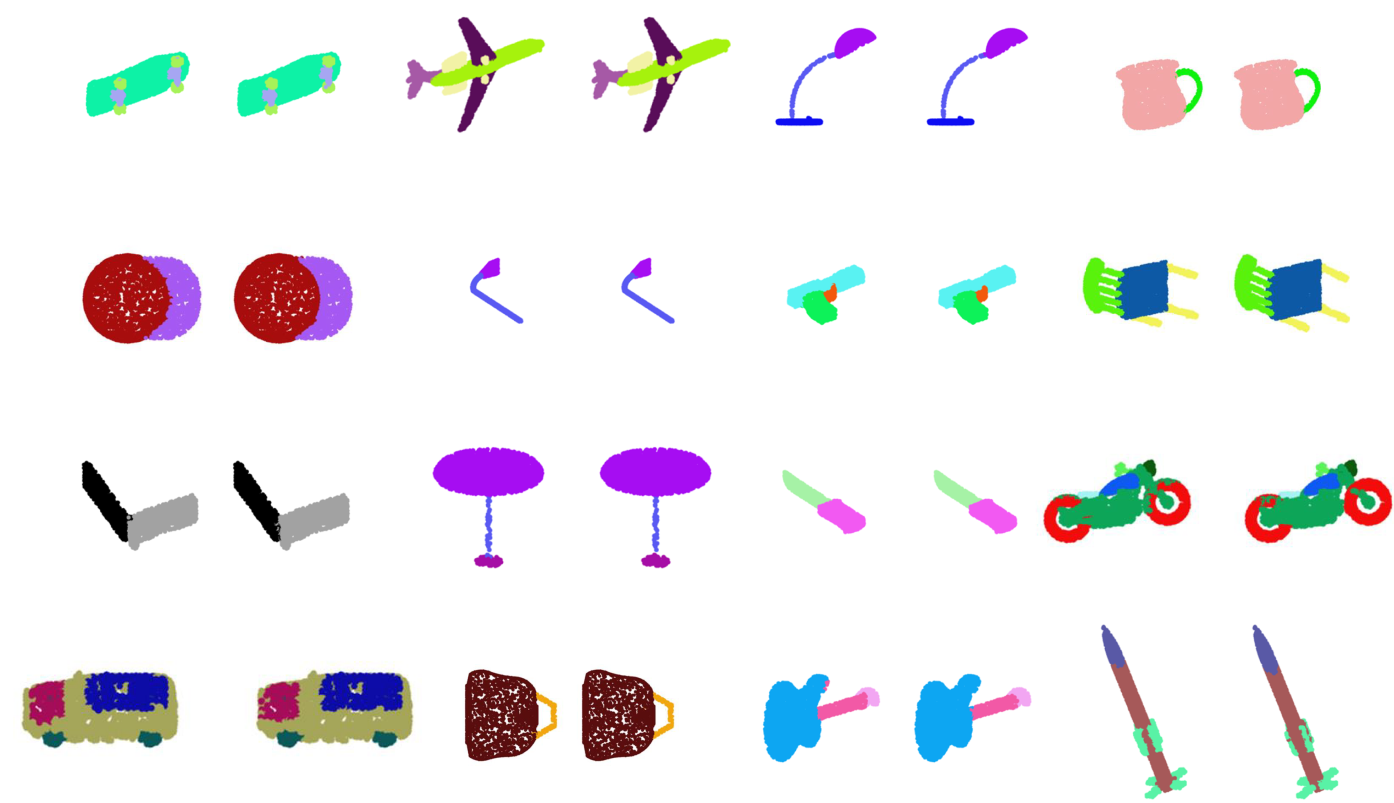
Segmentation
| Category (#) | PointNet | PointNet++ | PointCNN | DGCNN | SO-Net | RS-CNN | Pattern-Net |
| Areo (2690) | 83.4 | 82.4 | 82.4 | 84.0 | 82.8 | 83.5 | 84.3 |
| Bag (76) | 78.7 | 79.0 | 80.1 | 83.4 | 77.8 | 84.8 | 81.0 |
| Cap (55) | 82.5 | 87.7 | 85.5 | 86.7 | 88.0 | 88.8 | 87.4 |
| Car (898) | 74.9 | 77.3 | 79.5 | 77.8 | 77.3 | 79.6 | 80.1 |
| Chair (3758) | 89.6 | 90.8 | 90.8 | 90.6 | 90.6 | 91.2 | 91.4 |
| Ear (69) | 73.0 | 71.8 | 73.2 | 74.7 | 73.5 | 81.1 | 79.7 |
| Guitar (787) | 91.5 | 91.0 | 91.3 | 91.2 | 90.7 | 91.6 | 91.4 |
| Knife (392) | 85.9 | 85.9 | 86.0 | 87.5 | 83.9 | 88.4 | 88.1 |
| Lamp (1547) | 80.8 | 83.7 | 85.0 | 82.8 | 82.8 | 86.0 | 86.3 |
| Laptop (451) | 95.3 | 95.3 | 95.7 | 95.7 | 94.8 | 96.0 | 95.8 |
| Motor (202) | 65.2 | 71.6 | 73.2 | 66.3 | 69.1 | 73.7 | 72.1 |
| Mug (184) | 93.0 | 94.1 | 94.8 | 94.9 | 94.2 | 94.1 | 94.1 |
| Pistol (283) | 81.2 | 81.3 | 83.3 | 81.1 | 80.9 | 83.4 | 82.2 |
| Rocket (66) | 57.9 | 58.7 | 51.0 | 63.5 | 53.1 | 60.5 | 62.4 |
| Skate (152) | 72.8 | 76.4 | 75.0 | 74.5 | 72.9 | 77.7 | 72.4 |
| Table (5271) | 80.6 | 82.6 | 81.8 | 82.6 | 83.0 | 83.6 | 83.9 |
| Avg. | 83.7 | 85.1 | 85.1 | 85.2 | 84.9 | 86.2 | 86.4 |
Complexity Analysis
| Method | PointNet++ | PointCNN | DGCNN | SO-Net | RS-CNN | DensePoint | Pattern-Net |
| #params. | 1.48M | 8.2M | 11.8M | 11.5M | 1.41M | 670k | 399k |